You are viewing archived content. This content is no longer updated and links may not work.
Overview
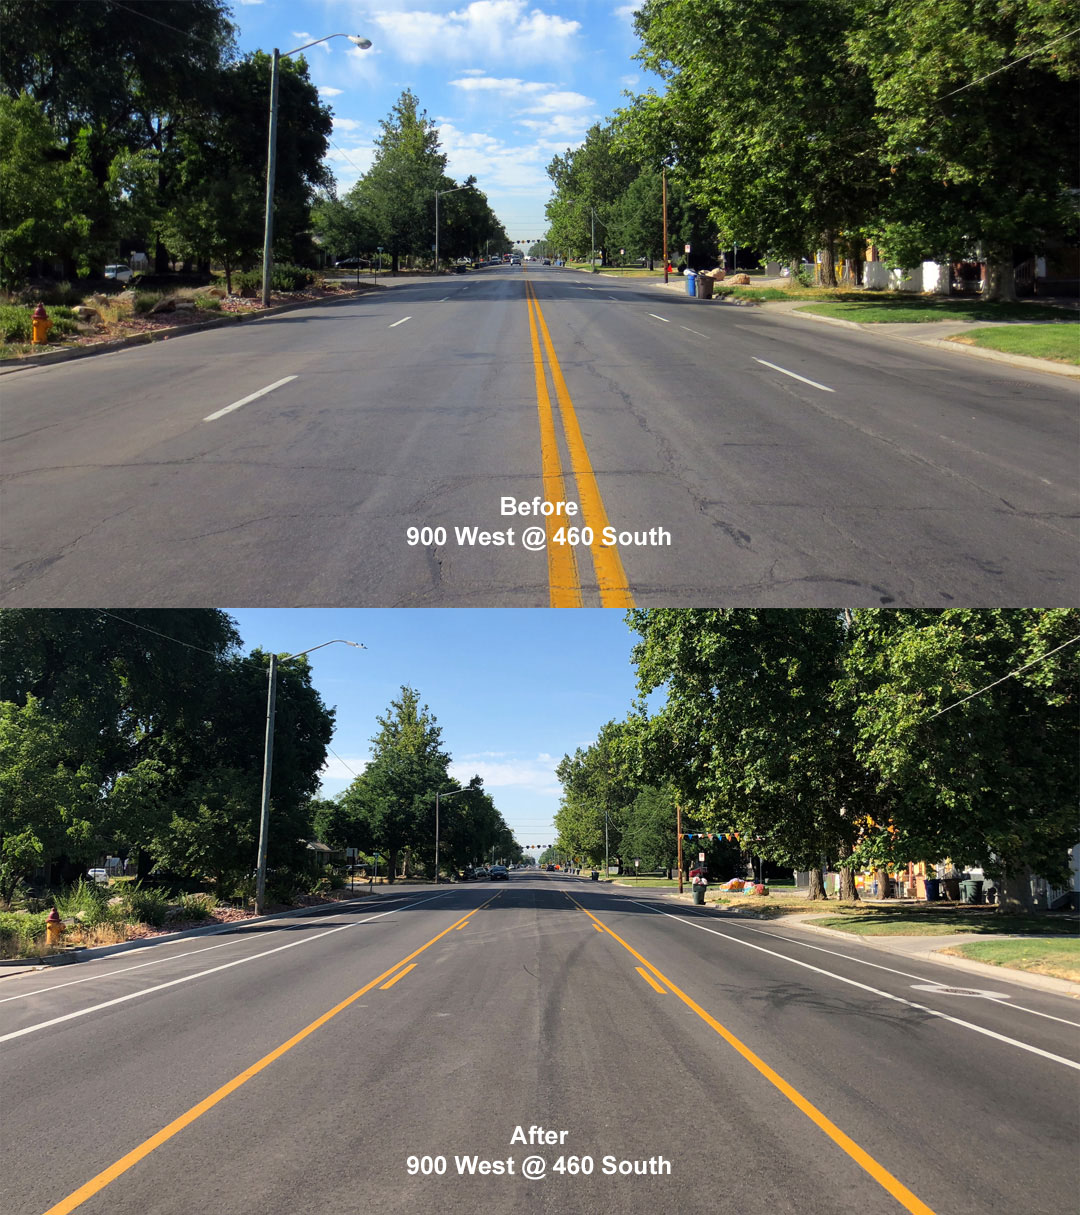
The 900 West Community Livability Project was implemented to increase livability, safety, and mobility for all roadway users. The project transformed 900 West from North Temple to 1700 South into a complete street with one vehicle lane in each direction, a center turn lane, bike lanes, and pedestrian and transit amenities. The roadway was converted from four to three travel lanes between 200 South and 800 South and from five to three travel lanes in all other areas. On-street parking was also added on both sides of the street between 800 and 1700 South. As part of the project, crosswalk improvements were made at 700 South, 800 South, and Genesee Ave. The crossing improvements and overall project are in support of the community’s desire for a neighborhood that is walkable and livable, as outlined in the Westside Master Plan.


Traffic volume and speed data
Within an appropriate range of traffic volumes, the conversion of a roadway from five or four lanes to three has little or no impact on roadway volumes. The traffic volumes on 900 West fall within the appropriate range and therefore we expect to see little to no impact on roadway volumes resulting from this project. With regards to travel speeds, a conversion from five or four lanes to three commonly reduces travel speeds since the most prudent driver now sets the speed for all drivers to the rear. In other words, faster drivers are forced to slow down since they don’t have another travel lane to use to go around slower drivers.

More data
- Sept/Oct 2015, 125 S, Volume/Speed Data Table
- May 2018, 125 S, Volume/Speed Data Table
- May 2019, 125 S, Volume/Speed Data Table
- Feb 2010, 320 S, Volume/Speed Data Table
- Sept/Oct 2015, 550 S, Volume/Speed Data Table
- May 2018 , 550 S, Volume/Speed Data Table
- May 2019, 550 S, Volume/Speed Data Table
- Oct 2007, 1000 S, Volume/Speed Data Table
- Sept/Oct 2015, 1197 S, Volume/Speed Data Table
- May 2018, 1197 S, Volume/Speed Data Table
- May 2019, 1197 S, Volume/Speed Data Table
- Sept/Oct 2015, 1550 S, Volume/Speed Data Table
- May 2018, 1550 S, Volume/Speed Data Table
- May 2019, 1550 S, Volume/Speed Data Table
- April 2020, 1197 S, Volume/Speed Data Table
Crashes during construction
Construction began on the 900 West Community Livability Project in July 2017 with substantial completion in November 2017. The following table and graph compare the total numbers of crashes that occurred during the construction period to the numbers of crashes that occurred during the same period from the three previous years. Please note that crashes occurring within construction zones likely do not represent typical roadway conditions and are therefore excluded from crash studies.


Three year after crash analysis
A simple before-and-after crash study was conducted for 900 West between North Temple and 1700 South, comparing crash data from three years before and after the project. Crashes that occurred during construction (July 1 to December 31, 2017) were excluded, as they likely do not reflect typical roadway conditions.
Before and after years for the study are as follows:
“Year -3” = July 1, 2014 – June 30, 2015
“Year -2” = July 1, 2015 – June 30, 2016
“Year -1” = July 1, 2016 – June 30, 2017
“Year +1” = January 1, 2018 – December 31, 2018
“Year +2” = January 1, 2019 – December 31, 2019
“Year +3” = January 1, 2020 – December 31, 2020


The crash types graph above indicates that for Years +1, +2 and +3, all crash types either decreased or remained about the same, as compared to the three years before project installation, except for rear-end crashes which show a pronounced increase initially but returned to average levels by year +3. To better understand the principal causes of the rear-end crashes, rear-end crashes for all years were analyzed and are shown in the graph below.
