SLC Food Environment Map & Report
The Food Environment Map & Report is a two part project – an online map and an in-depth report. Together, these tools demonstrate how food access is linked to city planning and highlight where food accessibility can be improved in Salt Lake City.
Using the Map
The Food Environment Map is structured around Council Districts and planning areas. It layers different food access sites over housing density, walkability, transit connectivity, income, land use, and redlining history to gain a clearer picture of food access in Salt Lake City.
There are multiple layers that can be turned on and off for comparison.
Map Layers
- Food Sites: Including Grocery Stores, Restaurants, Convenience Stores, Farmers Markets/Stands, Food Assistance Sites and Urban Agriculture sites indicated by individual point symbols
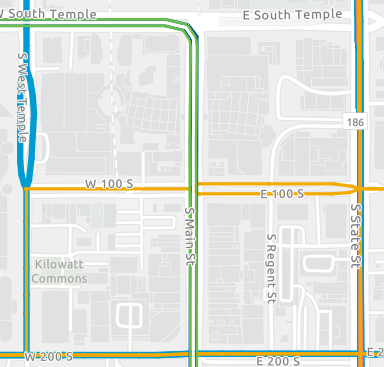
- Transportation: Including 2025 UTA transit routes and their function or frequency as well as bike pathways indicated by multicolor lines
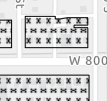
- Zoning: Including Mixed-Use Zoning, Open Space Zoning, and Public Land Zoning indicated by patterned area blocks
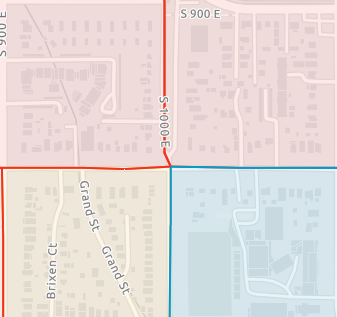
- Income Census Tracts: Including high, medium and low-income census tracts indicated by lightly shaded, multicolor overlays
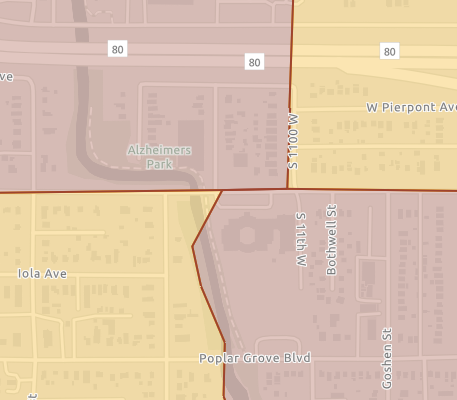
- Historically Redlined Neighborhoods: indicated by heavily shaded, multicolor overlays
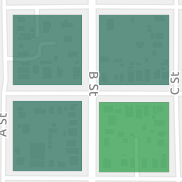
- Food Environment Score: this layer highlights how walkable a given housing block is to food sites. It accounts for housing density and variation in the quality of food sites. This ensures that places with low density and low food environment scores are represented differently than places with high density and low food environment scores. This is indicated by a blue-green heat map.

The Report Summary
The Food Environment Report takes the resulting data from the Map and cross-references it with 2022 Resident Food Access Survey data to identify priority areas for action and provide recommendations.
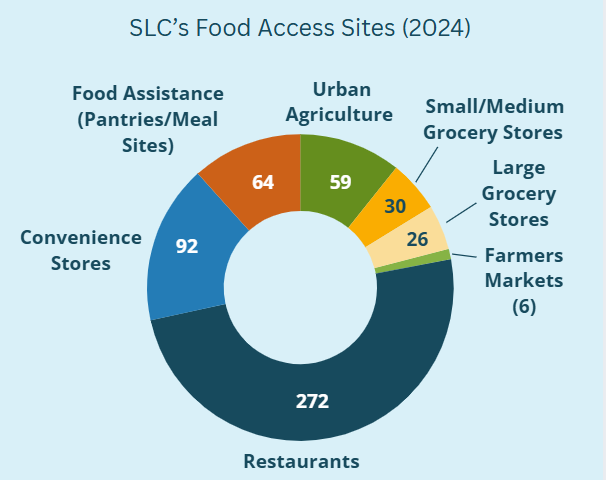
Total Numbers
Citywide Takeaways and Recommendations
Food Site Distribution
Takeaway: Grocery stores are unevenly distributed across the city, leaving lower‑income neighborhoods relying more on restaurants, convenience stores, and food pantries than on the healthy, affordable food options residents want.
Stats:
For every large/full grocery store, there are:
- 10.5 restaurants
- 3.5 convenience stores
- 2.5 food pantries
For all grocery/market sizes, there are:
- 4.9 restaurants
- 1.6 convenience stores
- 1.1 food pantries
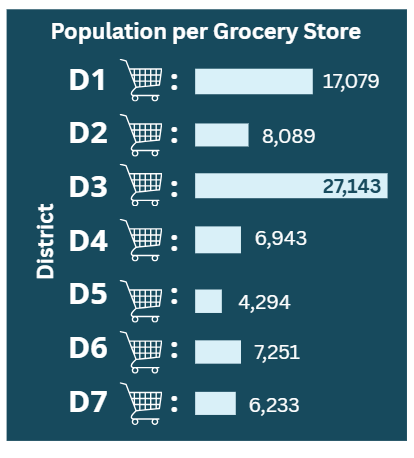
The number of large grocery stores varies widely from district to district. District 5 has 6 grocery stores serving 25,768 people where District 1 only has 2 grocery stores serving 34,158 people.
38% of SLC residents want more neighborhood markets or corner stores that sell fresh, healthy, and affordable food (72% of food insecure residents want the same).
About 1-in-3 SLC residents may be considered food insecure.
Recommendation: Invest in grocery stores of all scales, especially neighborhood markets, corner stores, and farmers markets to promote equitable and affordable access to fresh, healthy, and local options.
Priority Areas: Districts 1, 2, 4, 5, or Citywide
Transit Connectivity
Takeaway: Access to healthy food in Salt Lake City depends heavily on having a car. Many grocery stores are not easily reached by walking, biking, mobility devices, or public transit.
Stats:
84% of SLC residents drive their own car to get food
3% use public transit
6% walk/mobility device
3% bike
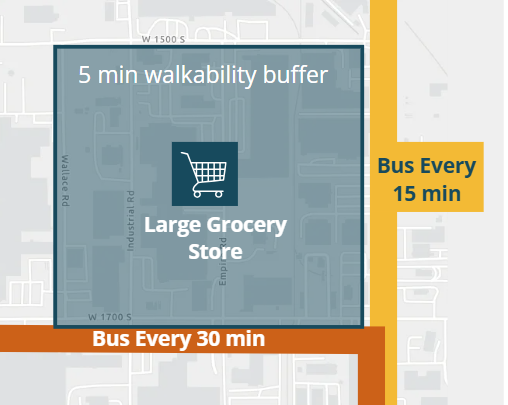
Example: A large grocery store in District 2 only has two transit lines within a 5 minute walk. One only comes every 30 minutes.
Recommendation: Improve transit, pedestrian, and cycling connections to food sources, and make healthy food access a consideration in public transportation planning.
Priority Areas: Districts 1, 2, 3
Urban Agriculture
Takeaway: Food production relies on available land and resources, but in a growing city, space for urban agriculture is increasingly limited.
Stats:
34% of SLC residents grow some of their own food.
27% of residents want more space to grow food.
Most community gardens and urban farms are on the Westside.
There are less than 30 acres of land in food production for human consumption. (This doesn’t include the 2 ranches within SLC’s boundaries or other land zoned as agricultural use for pasture or alfalfa production.)
Recommendation: Protect existing growing spaces, improve land access for urban growers, and expand resources to support affordable, climate‑resilient food production.
Priority Areas: Citywide
Notes on Making the Map
Key questions informing the map
- Where do people get food in SLC?
- What kinds of food resources are available in different neighborhoods?
- How do people travel to food?
- What kinds of neighborhood environment, zoning, or street designs allow for easy access to healthy food?
- Do green spaces foster food production? If so, where and for whom?
Walkability Buffers
This map was made using 5, 10, and 15, minute walking buffers around each food site type to give each housing block its score. Though a more exact approach was not available to use for this version, it would be a useful addition to future versions of the map.
Scoring Food Sites
Food sites were scored based on several factors. Grocery stores and farmers markets got higher scores due to freshness, choice of food, and price ranges. Food assistance sites (less choices, less often fresh) and restaurants (less often fresh, more expensive) were given medium scores. Convenience stores (less often fresh, less choices, but affordable) and urban agriculture sites (fresh and can be affordable but limited by season) got the lowest scores.
Sites that accept SNAP gain a point, and this includes many convenience stores, grocery stores, and farmers markets.
For future versions of the map, it would be useful to account for a full inventory of what individual stores offer as far as healthy or fresh options.
Mapping Every Food Site
This map necessarily misses a few sites as they go out of business or are replaced. For future versions of the map, it would be useful to include a robust update of the food sites inventory and automate regular updates.
The map is also missing several food site types that would be useful to include in future versions of the map. These are:
- Institutional sites like hospitals, schools, or jails/prisons
- Bars, cafes, or drive-through coffee shops, soda shops, and bakeries