You are viewing archived content. Please note that this content is no longer updated and links may not work.
Overview
The California Avenue Community Livability Project was implemented to increase livability, safety, and mobility for all roadway users. The project transformed California Ave from Redwood Rd to 700 West from a four-lane undivided roadway into a complete street with one vehicle travel lane in each direction, a continuous two-way left-turn lane and bicycle lanes. The project was constructed in August 2011.

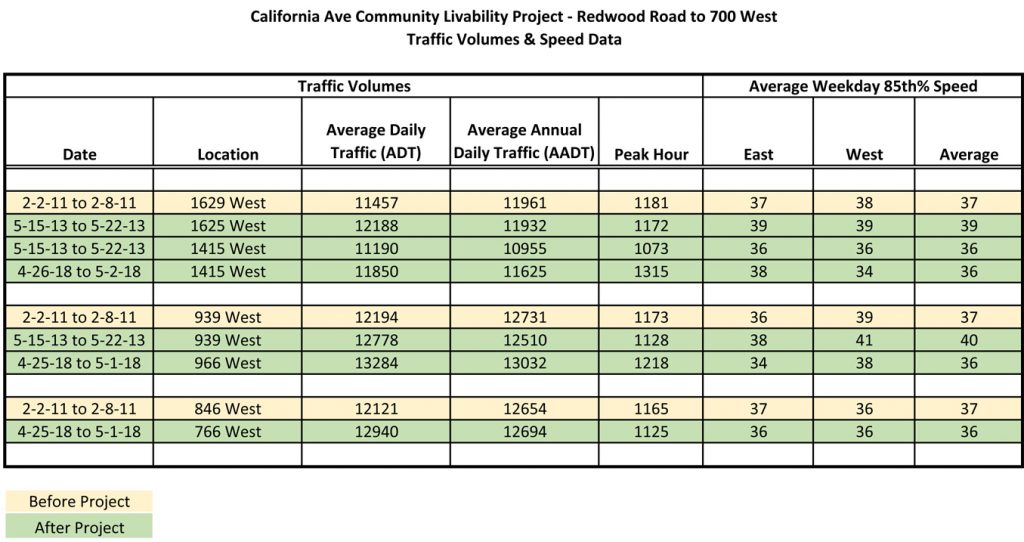
Traffic volume and speed data
When traffic volumes are within a certain range, converting a road from four lanes to three generally has little impact on how much traffic it carries. Traffic on 1300 South fell within this range, so we expected minimal change. This type of conversion often lowers travel speeds, as drivers must follow the pace of the lead vehicle without an extra lane to pass slower traffic.
More data
- February 2011, 1629 W California Ave, Volume/Speed Data Table
- May 2013, 1625 W California Ave, Volume/Speed Data Table
- May 2013, 1415 W California Ave, Volume/Speed Data Table
- April 2018, 1415 W California Ave, Volume/Speed Data Table
- February 2011, 939 W California Ave, Volume/Speed Data Table
- May 2013, 939 W California Ave, Volume/Speed Table
- April 2018, 966 W California Ave, Volume/Speed Data Table
- February 2011, 846 W California Ave, Volume/Speed Data Table
- April 2018, 766 W California Ave, Volume/Speed Data Table
Crash analysis
| Overall Crashes on California Ave – Redwood Rd to 700 West | |||
| Roadway Improvements completed in August 2011 | |||
| SLC Data Set | |||
| Date Range | Overall Crashes | Ped Crashes | Bike Crashes |
| 8/1/08 to 7/31/09 | 67 | 1 | 3 |
| 8/1/09 to 7/31/10 | 55 | 1 | 1 |
| 8/1/10 to 7/31/11 | 49 | 2 | 2 |
| 10/1/11 to 9/30/12 | 55 | 3 | 1 |
| 10/1/12 to 9/30/13 | 45 | 0 | 0 |
| 10/1/13 to 9/30/14 | 40 | 0 | 2 |
| 10/1/14 to 9/30/15 | 35 | 2 | 1 |
| 10/1/15 to 9/30/16 | 40 | 1 | 0 |
| 10/1/16 to 9/30/17 | 51 | 0 | 1 |
| 3-Year Annual Average Before | 57 | 1 | 2 |
| 6-Year Annual Average After | 44 | 1 | 1 |
| % Change | -22.2% | ||
| Injury Crashes on California Ave – Redwood Rd to 700 West | |||
| Roadway Improvements completed in August 2011 | |||
| SLC Data Set (Severity 3+) | |||
| Date Range | Overall Crashes | Ped Crashes | Bike Crashes |
| 8/1/08 to 7/31/09 | 9 | 1 | 2 |
| 8/1/09 to 7/31/10 | 5 | 1 | 1 |
| 8/1/10 to 7/31/11 | 7 | 2 | 2 |
| 10/1/11 to 9/30/12 | 8 | 1 | 0 |
| 10/1/12 to 9/30/13 | 9 | 0 | 0 |
| 10/1/13 to 9/30/14 | 3 | 0 | 2 |
| 10/1/14 to 9/30/15 | 3 | 2 | 1 |
| 10/1/15 to 9/30/16 | 8 | 1 | 0 |
| 10/1/16 to 9/30/17 | 5 | 0 | 1 |
| 3-Year Annual Average Before | 7 | 1 | 2 |
| 6-Year Annual Average After | 6 | 1 | 1 |
| % Change | -14.3% | ||