Community Food Assessment 2013
The Community Food Assessment 2013 was a “snapshot in time” of Salt Lake City’s food system. It provided analysis of data and policy, and supplied the Food Policy Council, the City, and the public with basic information about our food system, in order to make informed decisions about how we can work together to develop a more local, affordable, and sustainable food system.
Highlights
Farms surrounding Salt Lake City
- There were 40,988 farms within 250 miles of Salt Lake City
- There were 16,600 farms in Utah
- Top 5 Commodities: Dairy, Cattle, Hogs, Turkey, and Chicken eggs
Land Use Statistics
“For farmers and local food consumers, the best, or prime agricultural land, is also prime developable land.”
- Over 4,321 square miles of agricultural land
- Over 1,244 square miles of developed land
- About 30% of Utah’s agricultural land has been developed with urban and suburban sprawl
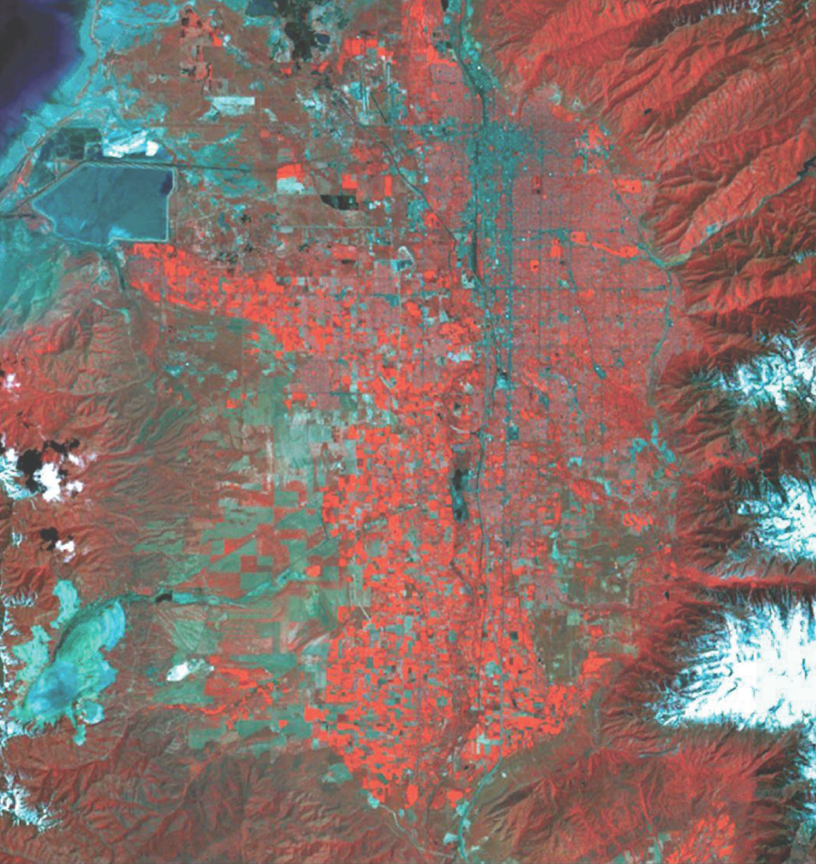
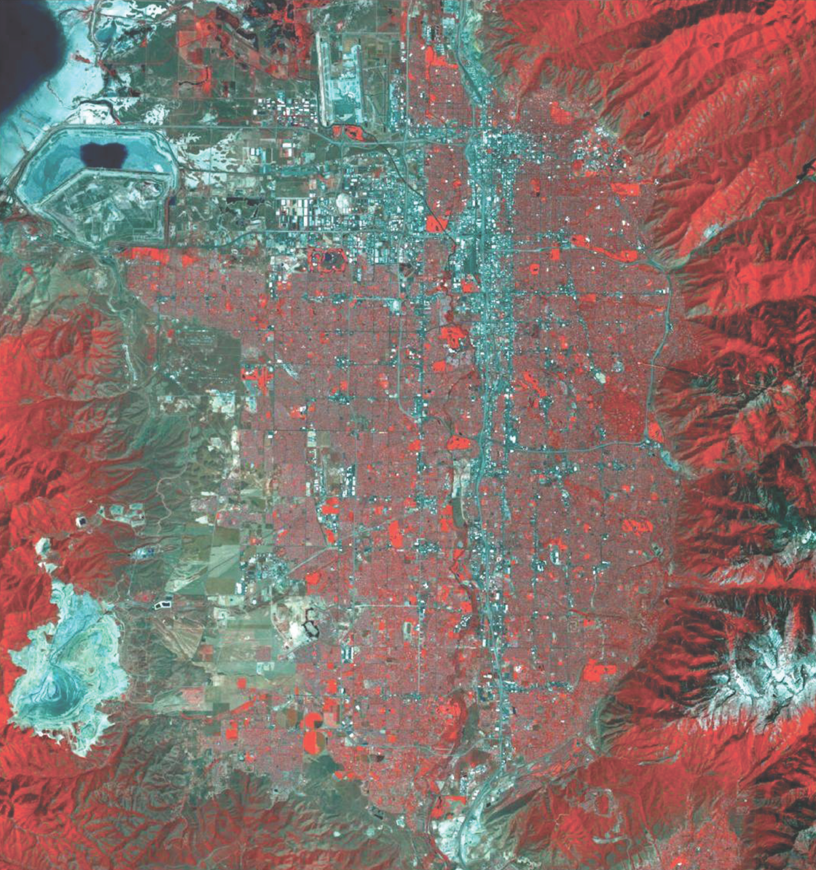
Salt Lake Valley Agricultural Land Over Time:
(Agricultural Land in Red)
Where do we get our food in SLC?
- 76 convenience/gas marts
- 63 grocery retail locations
- 8 farmers markets
Population Growth
- From 1990 to 2010 Salt Lake City’s population increased by 17% (from 159936 to 186440)
Food Assistance
- SLC Food Stamp Recipients 2011: 27,212 Households
- Family of 4 monthly food stamp allocation: $668
- Single Adult monthly food stamp allocation: $200
- Utah Food Bank diverted 12 million pounds of food to families in need in 2012 from participating grocery stores. UFB’s “grocery rescue” program gathered donations from grocery stores and delivers it to local pantries.
Food Waste
- The largest type of waste by weight in Salt Lake residents’ waste was food scraps (approx. 20%)